Preproduction:
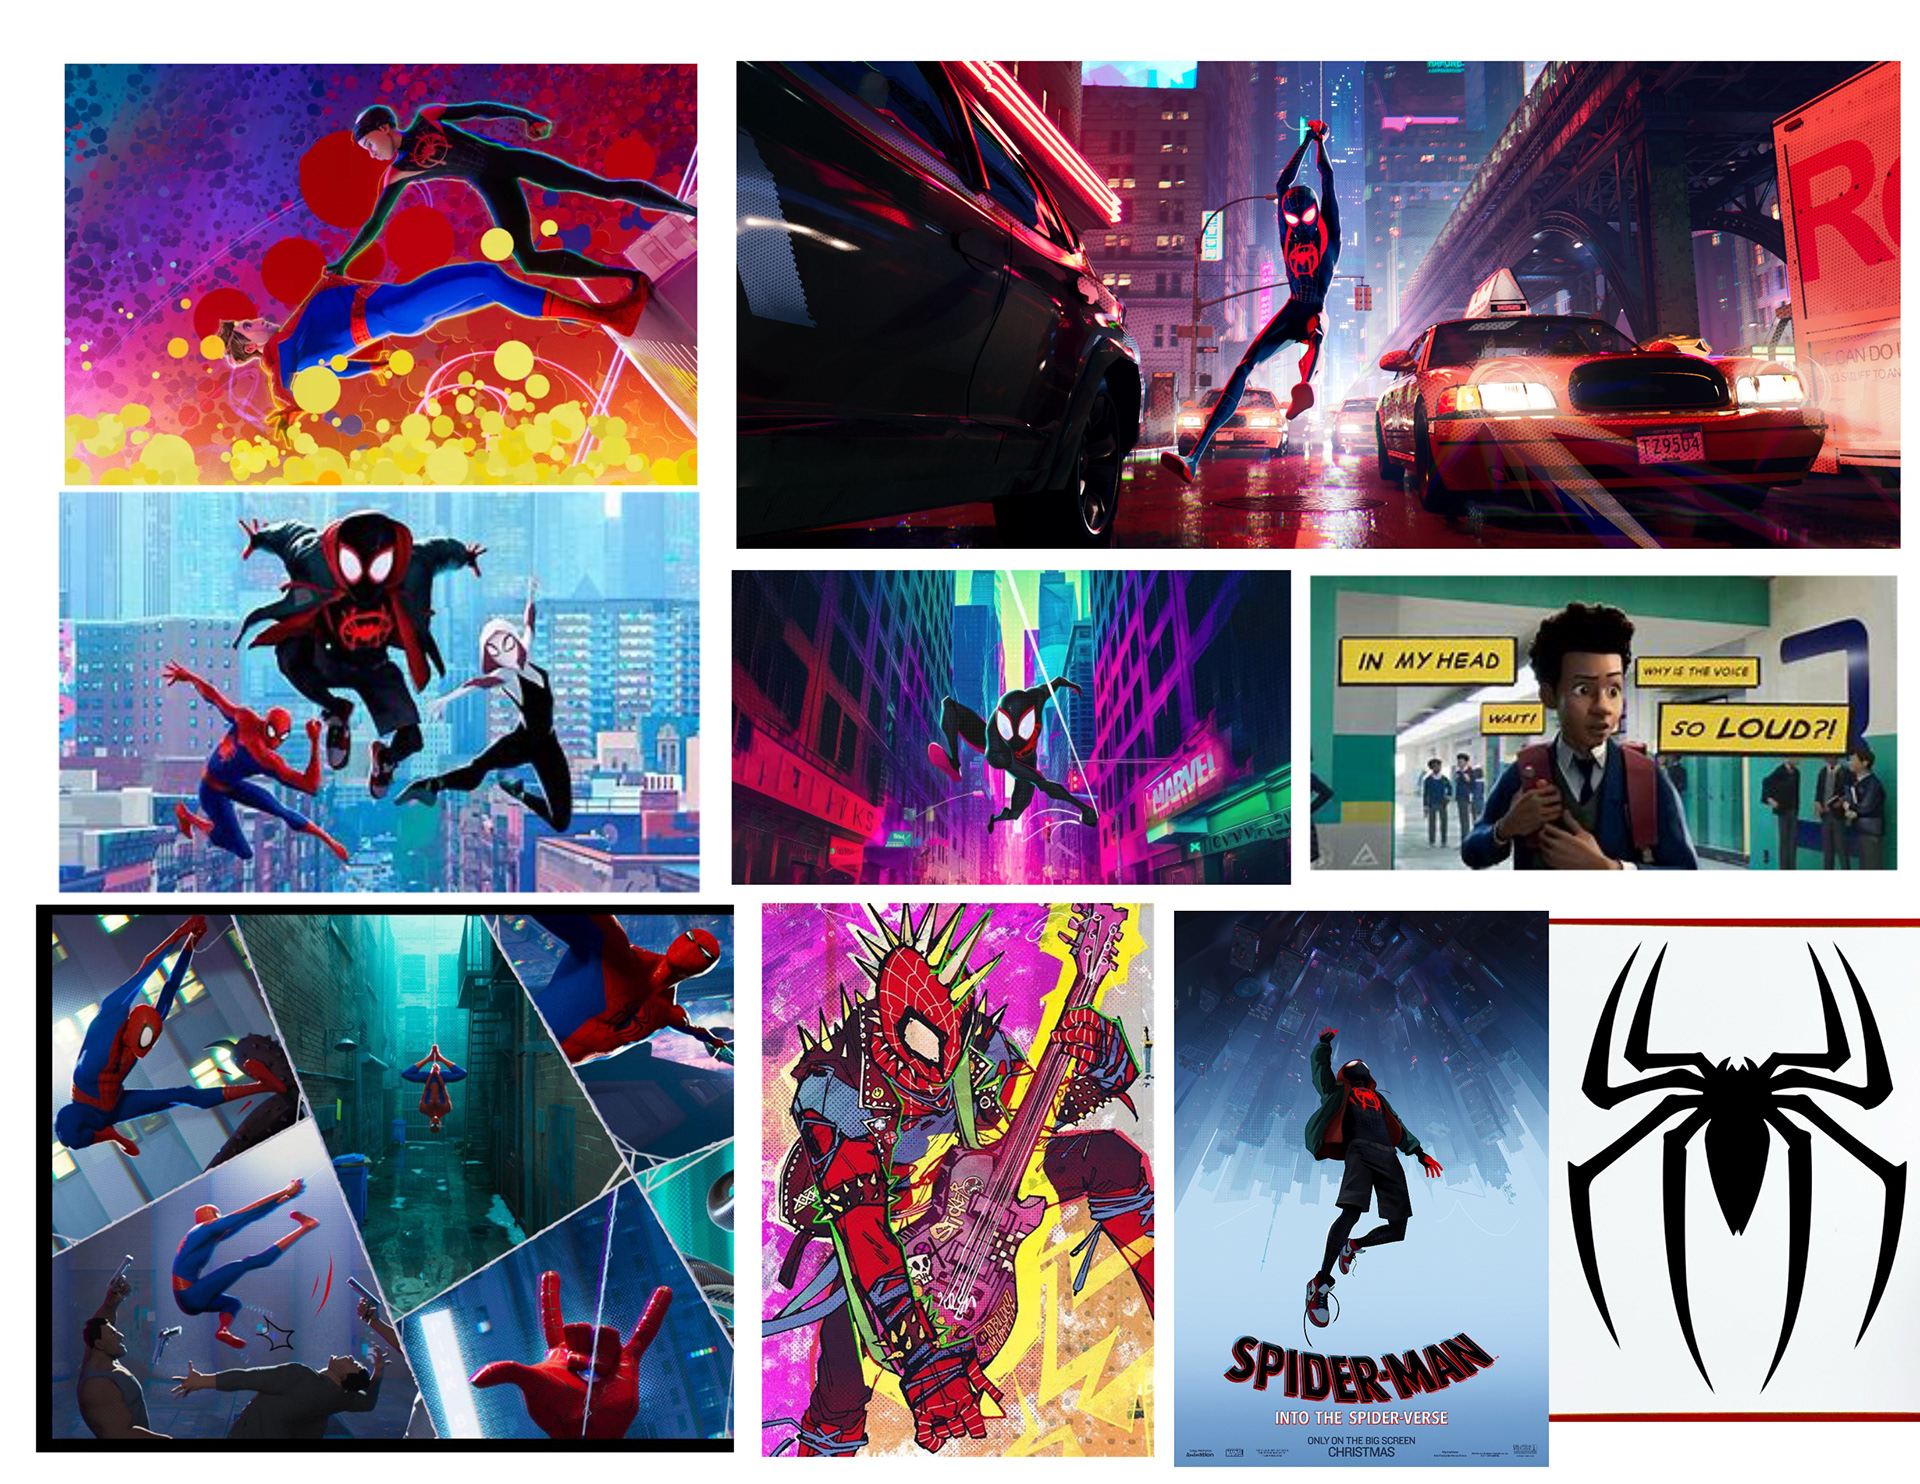
Research: Conducted thorough research to understand the topic and gather relevant data.
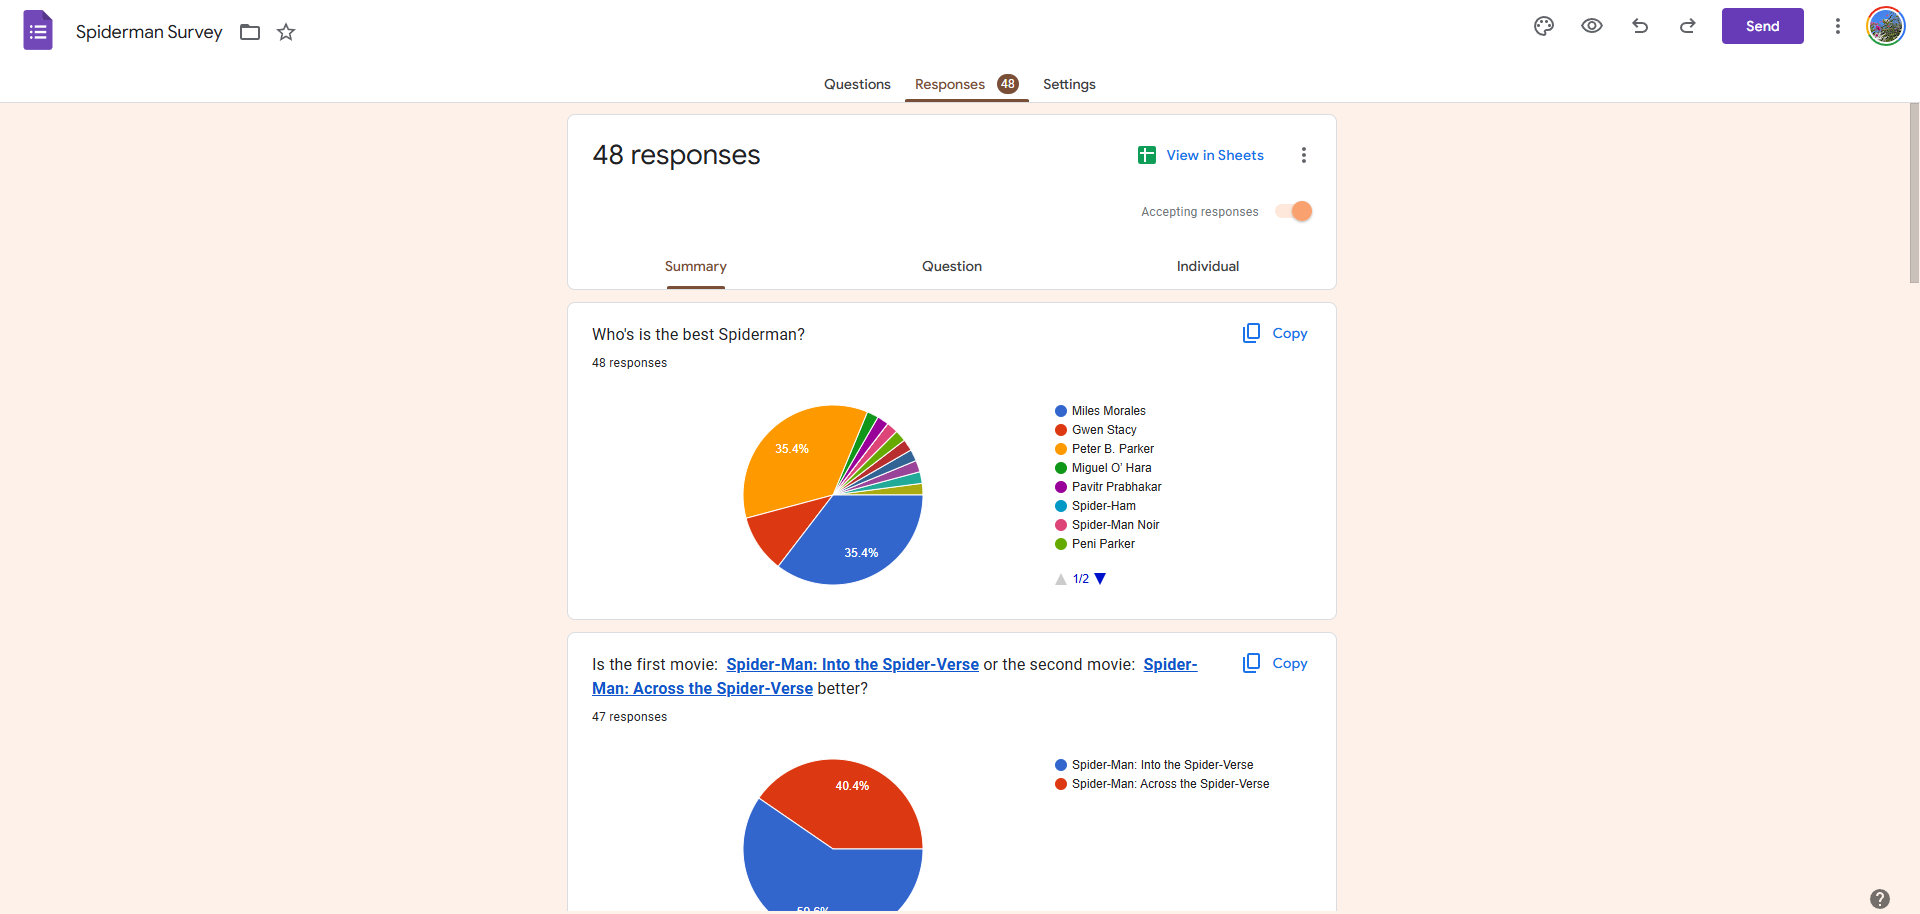
Survey: Designed and distributed a survey to approximately 50 participants to collect their opinions and insights.
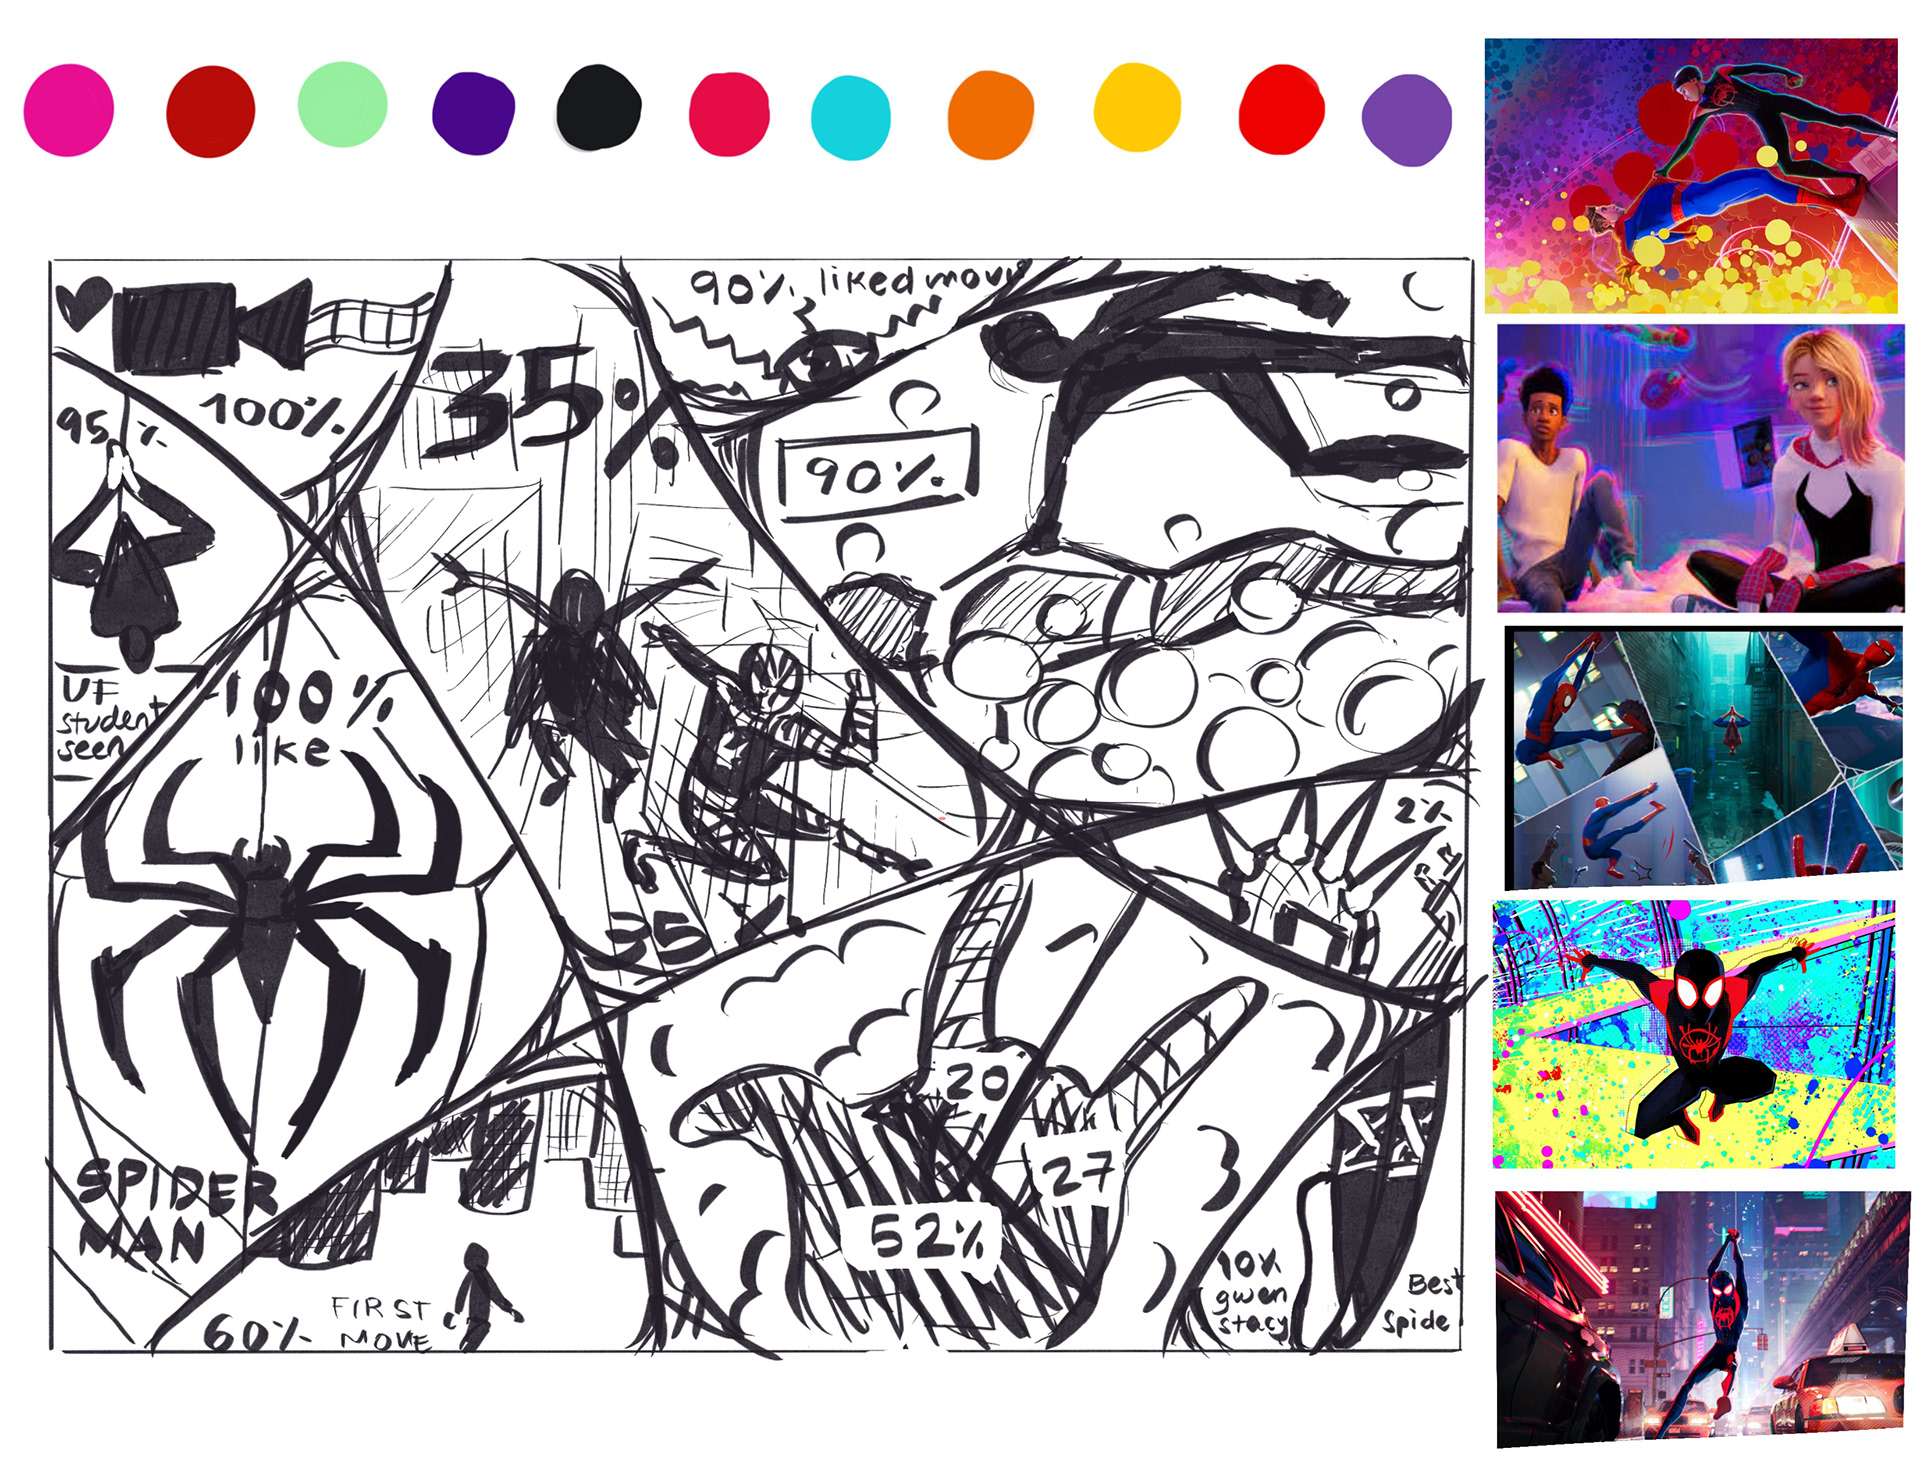
Sketching: Created initial sketches and wireframes to visualize the layout and structure of the infographic.
Production:
Design: Utilized tools like Procreate and Photoshop to bring the sketches to life, focusing on aesthetics and user engagement.
Iteration: Refined the design through multiple iterations based on feedback and self-evaluation.
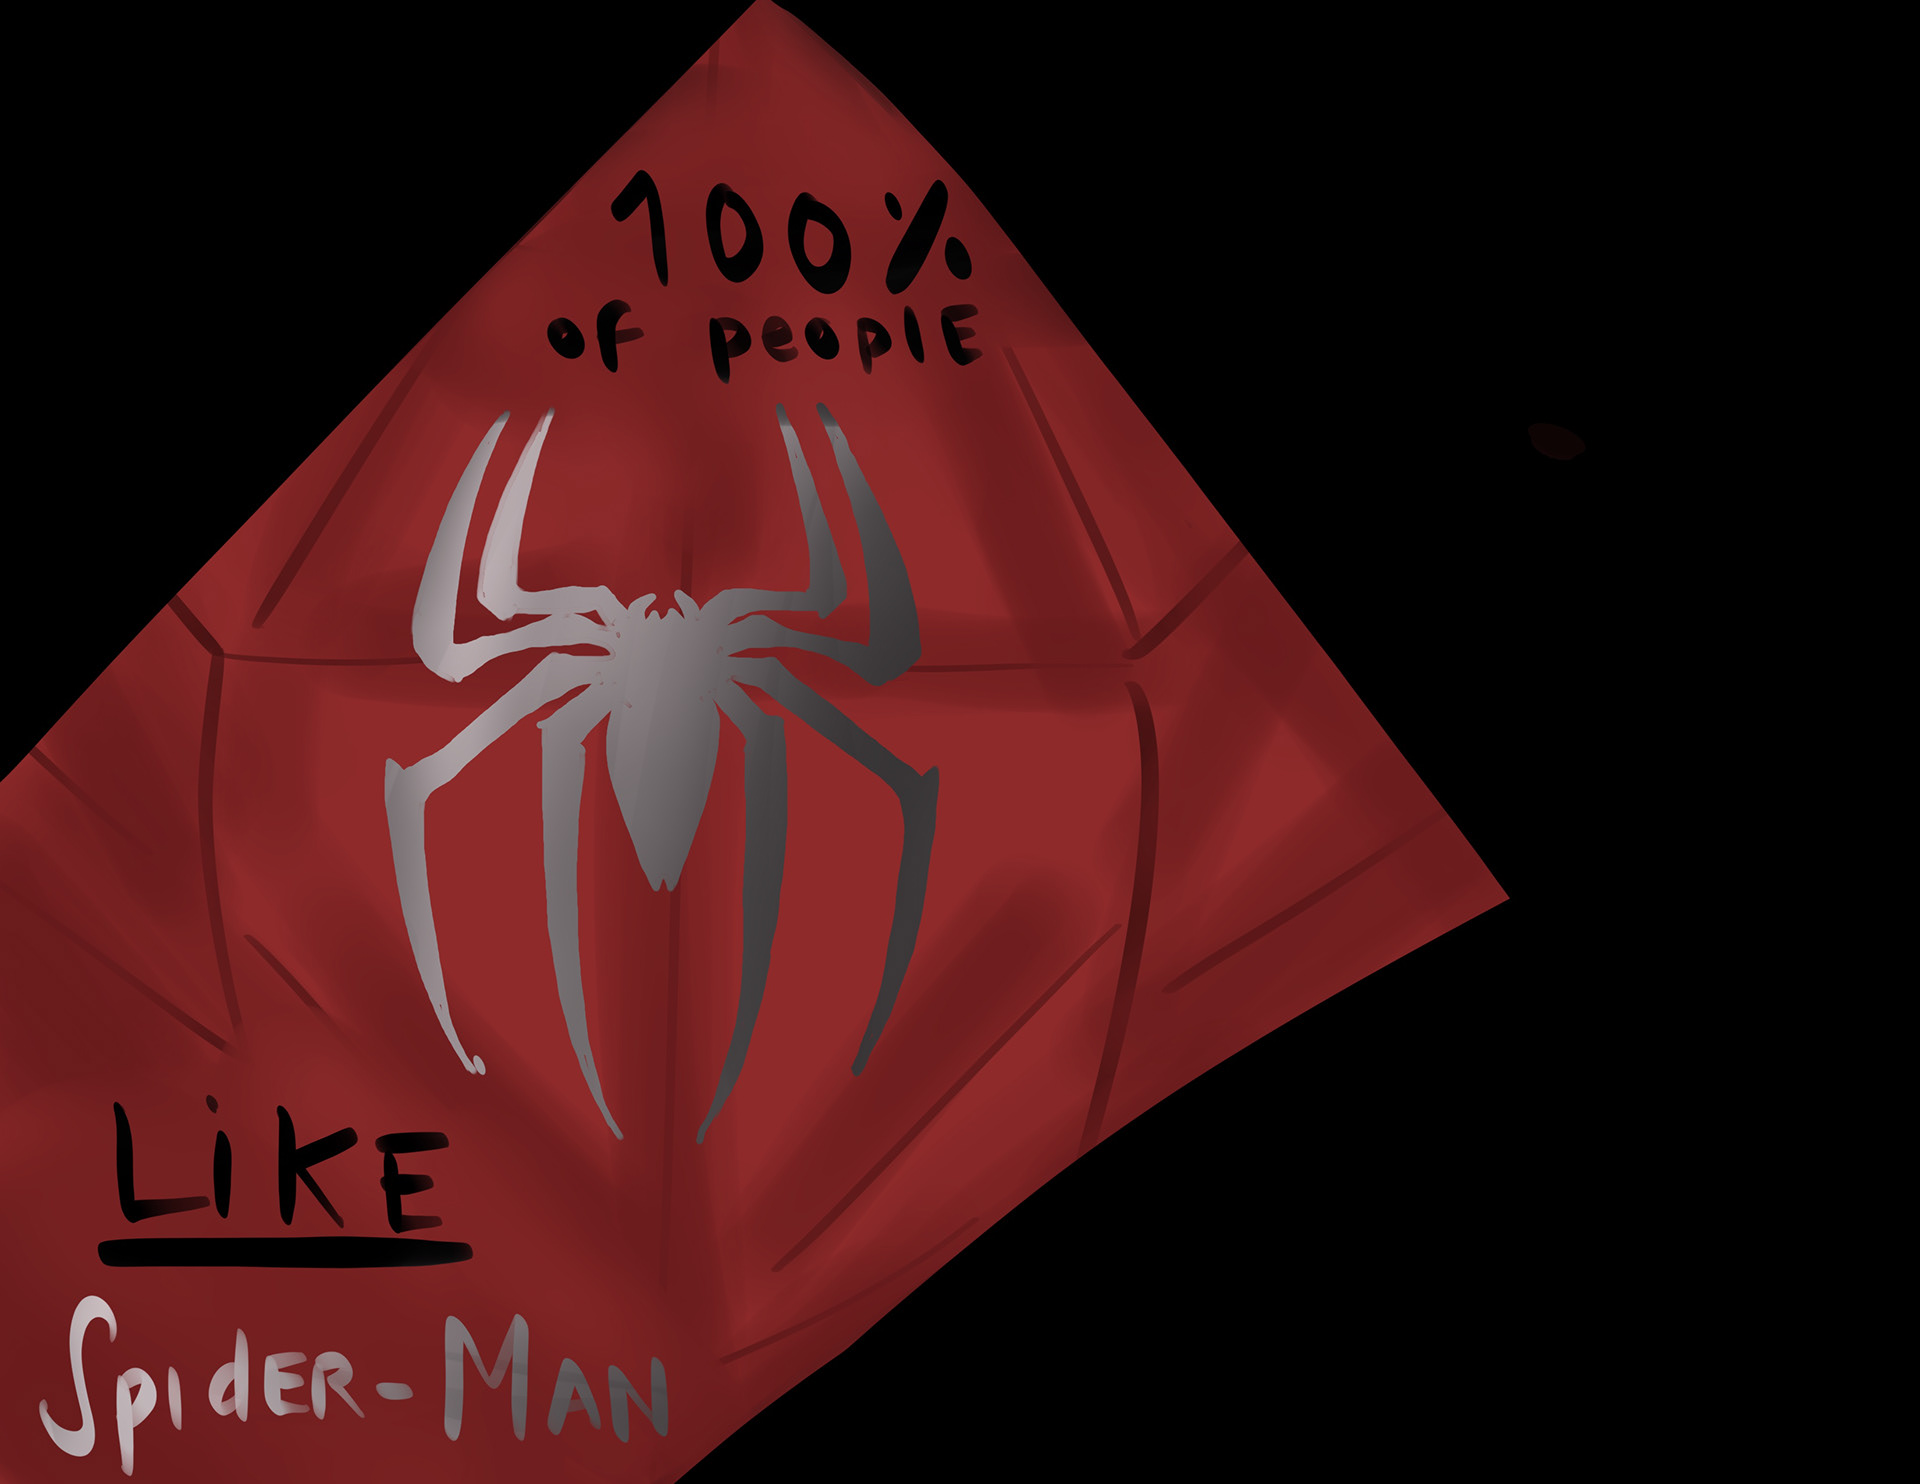
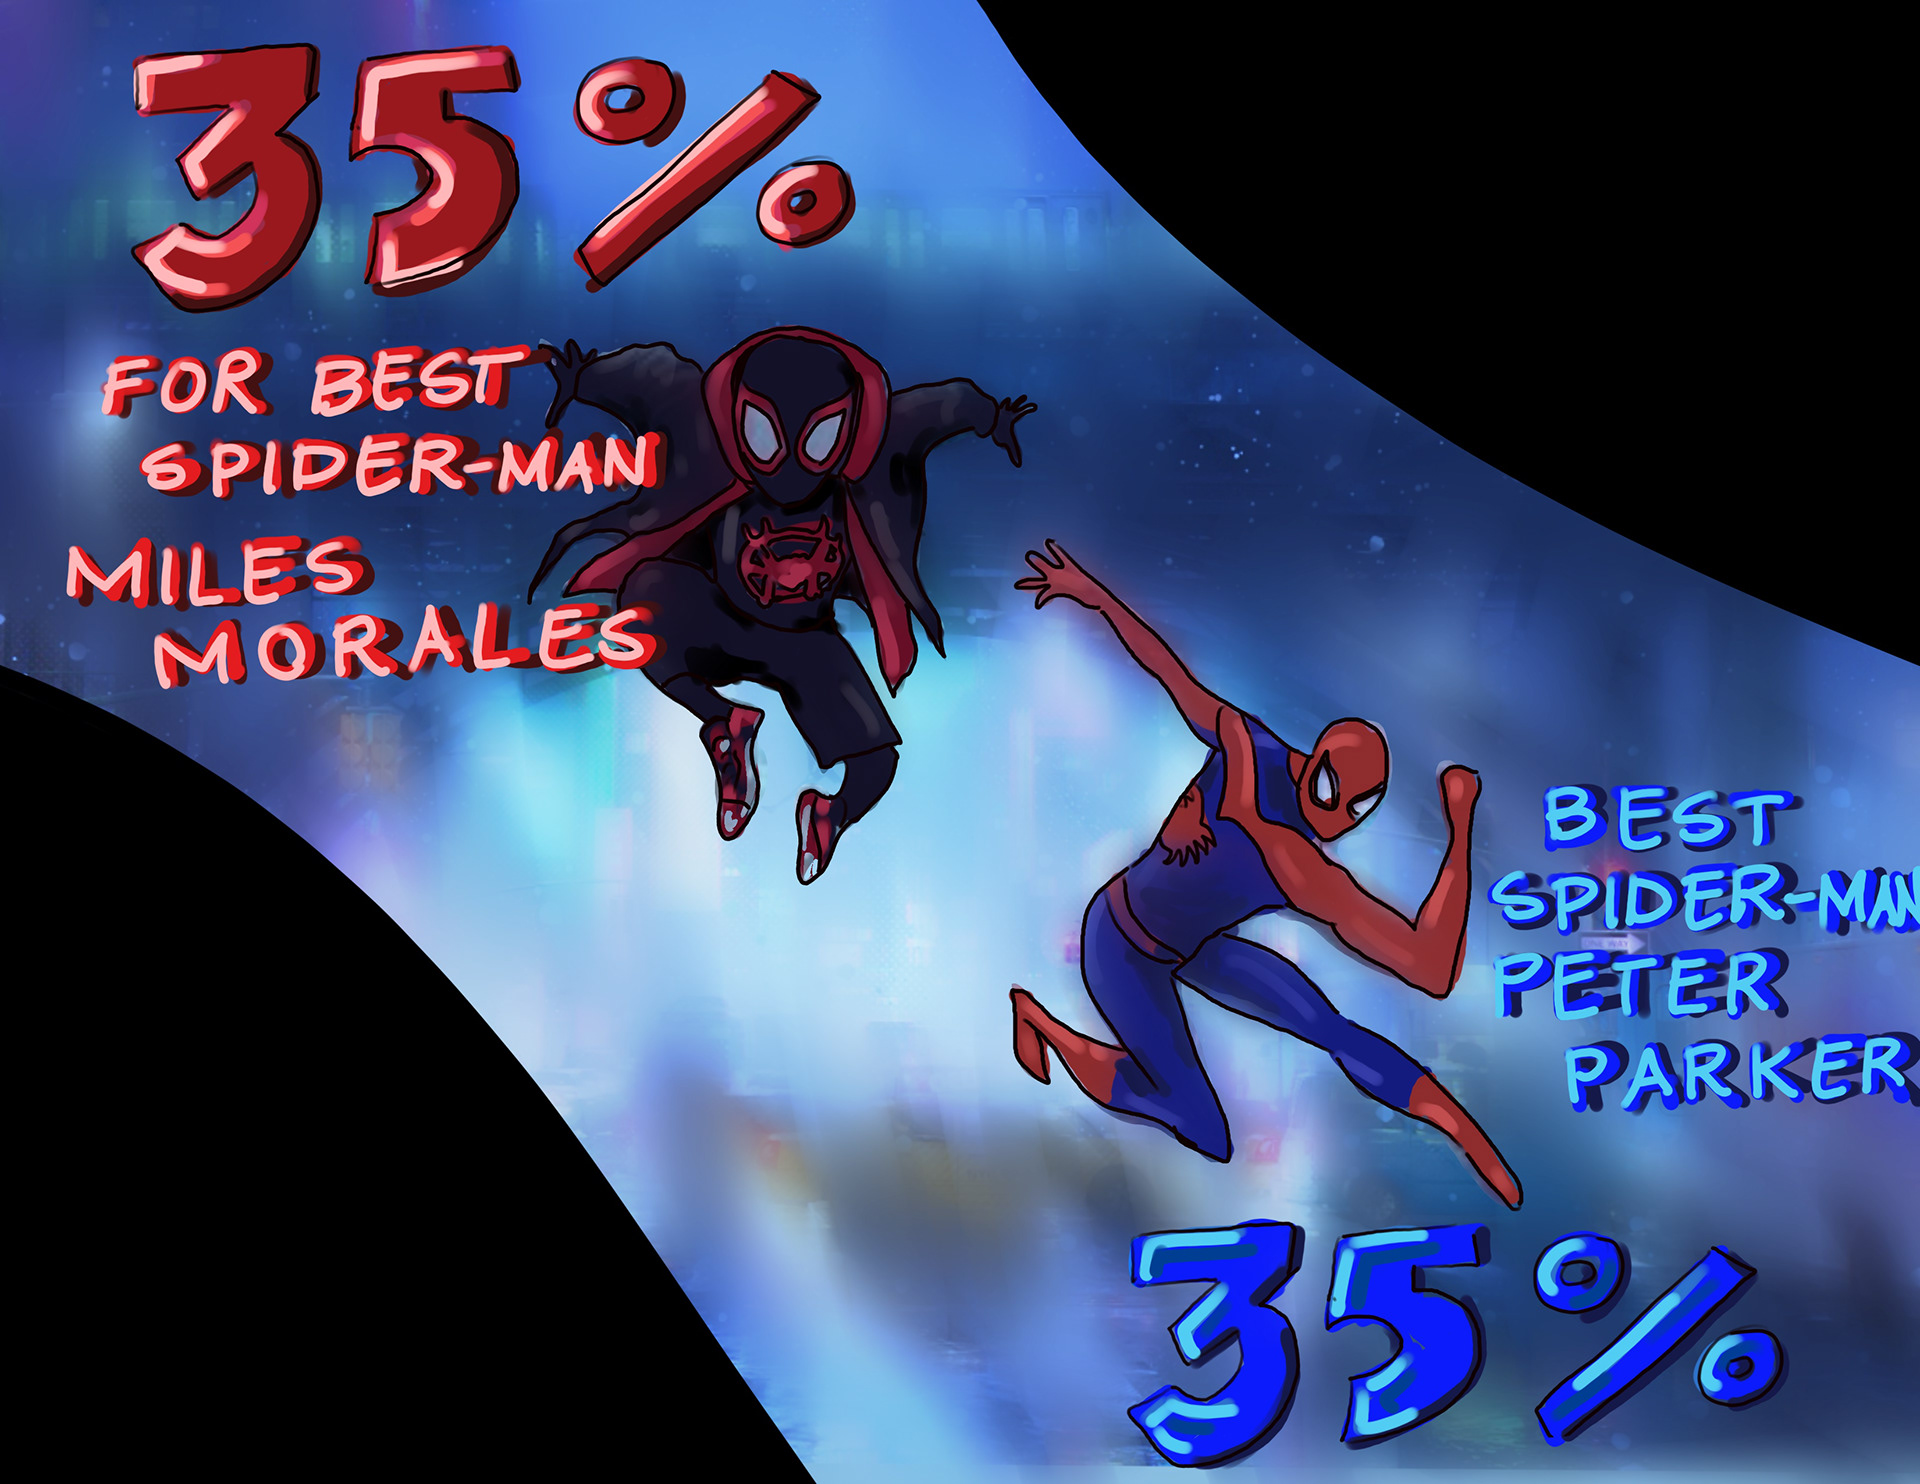
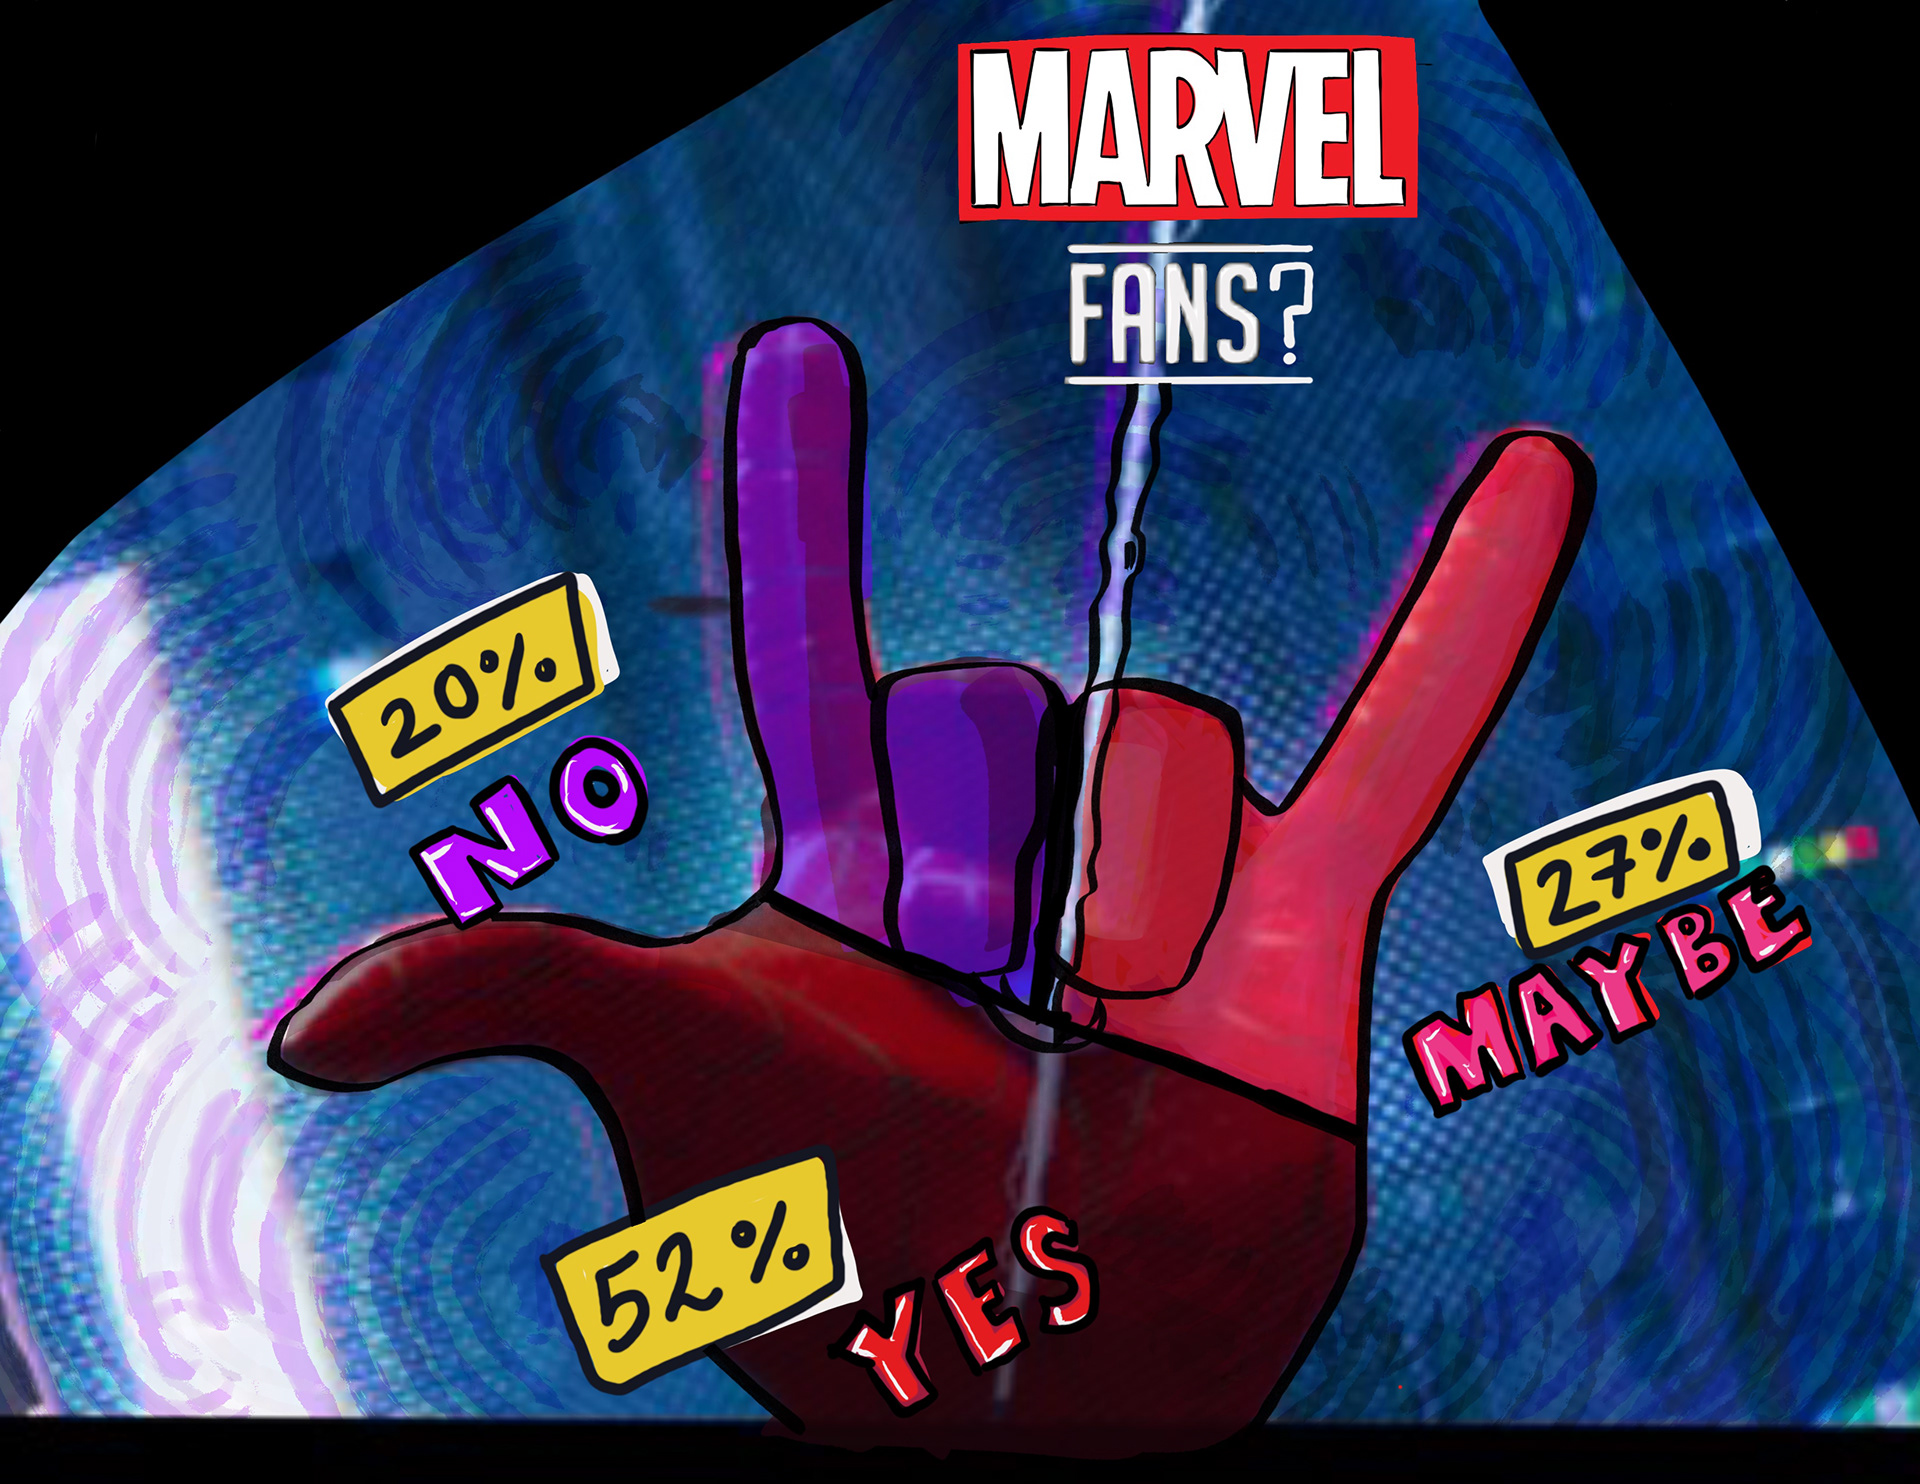
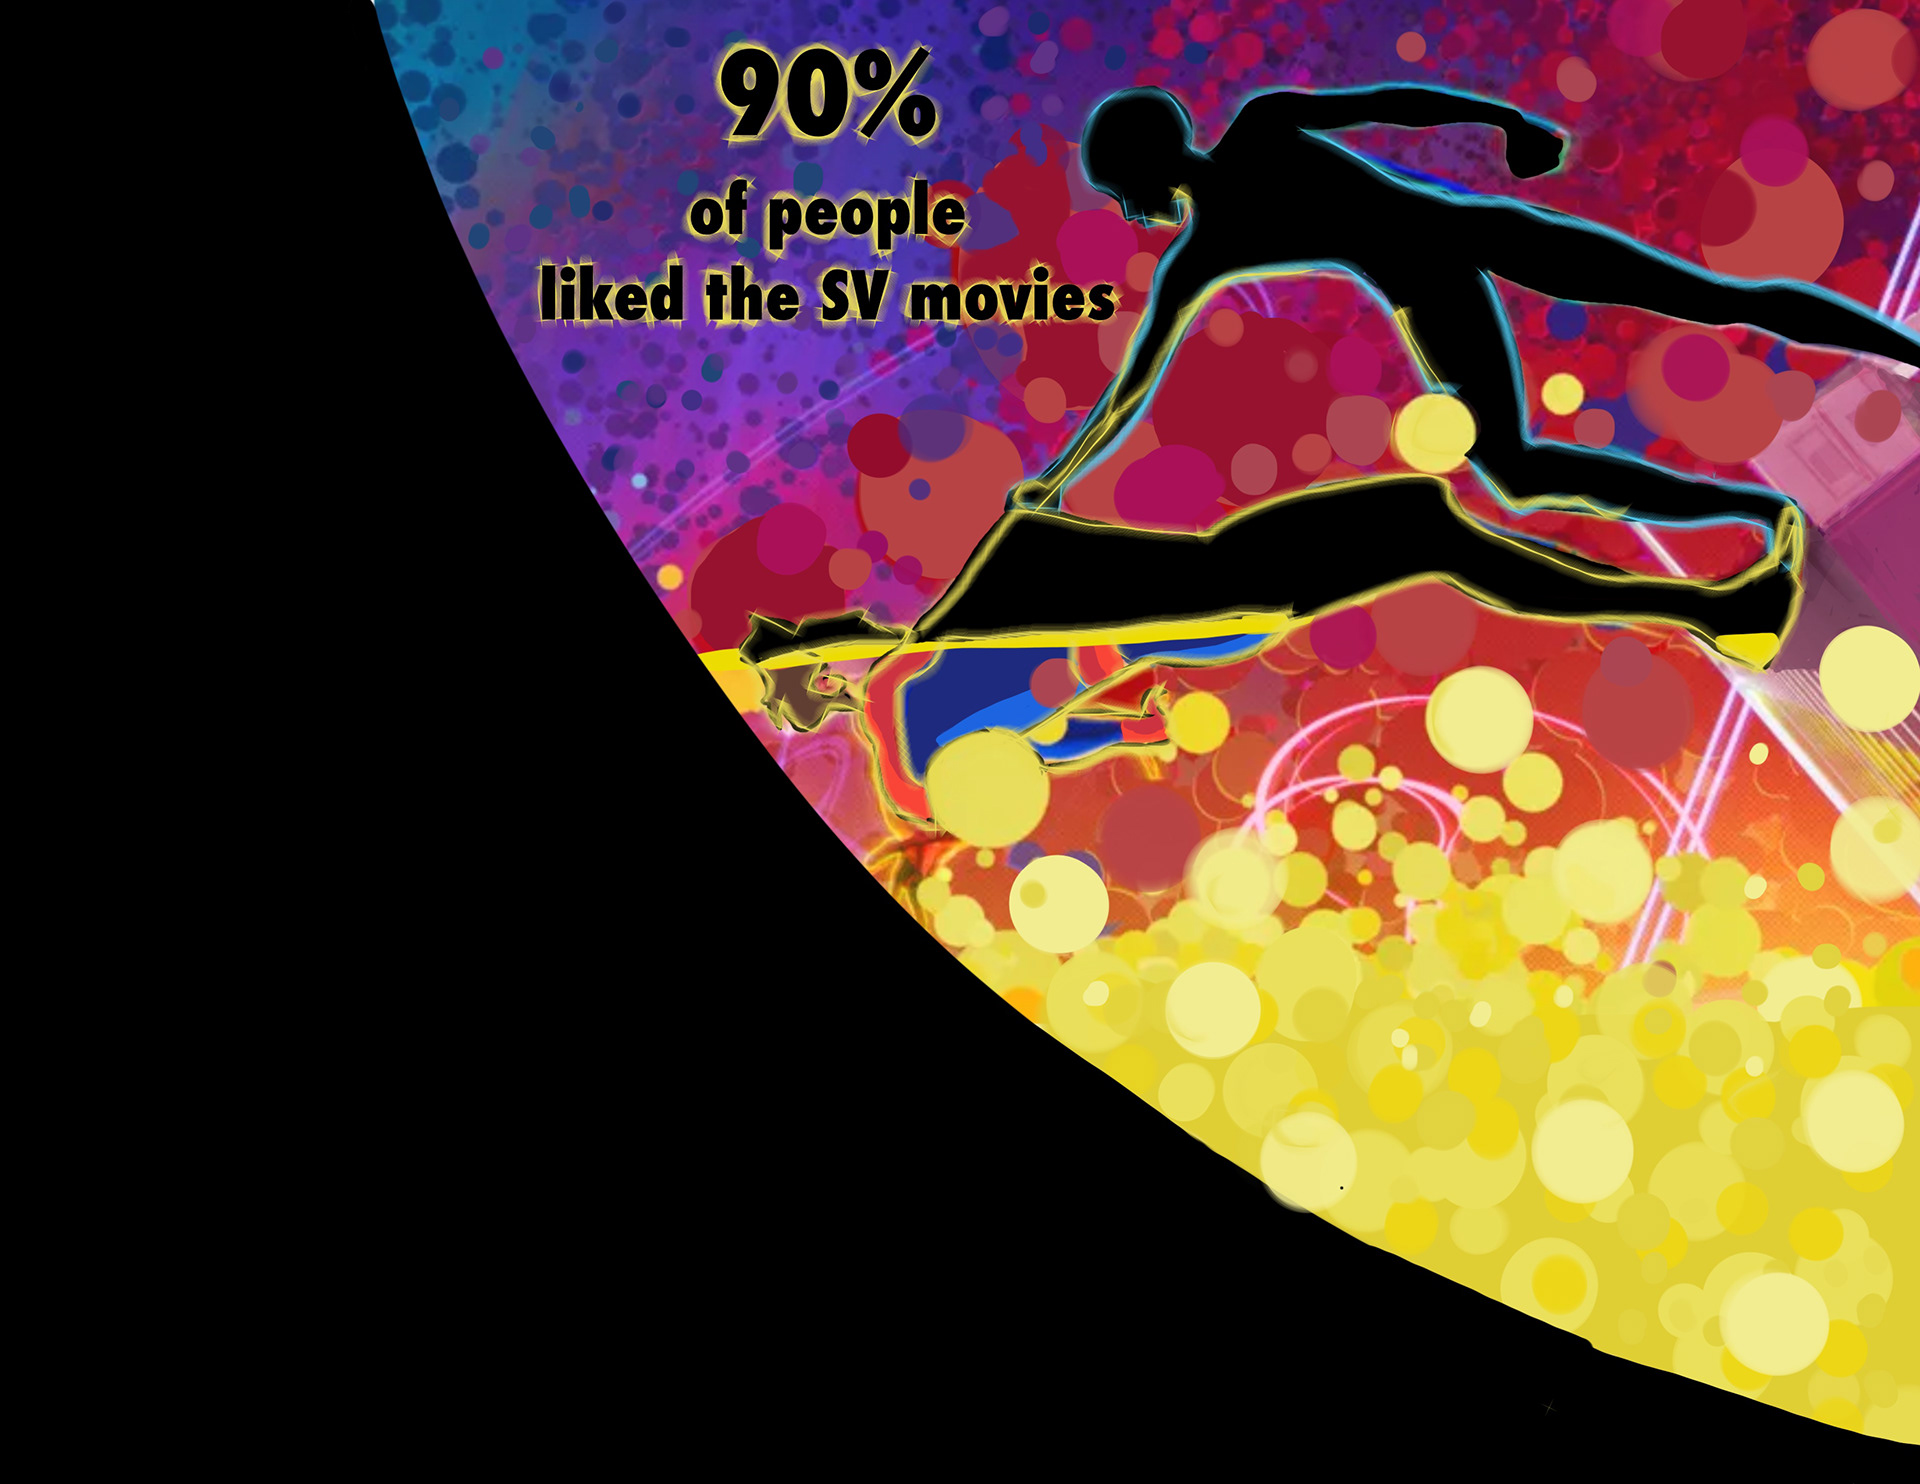
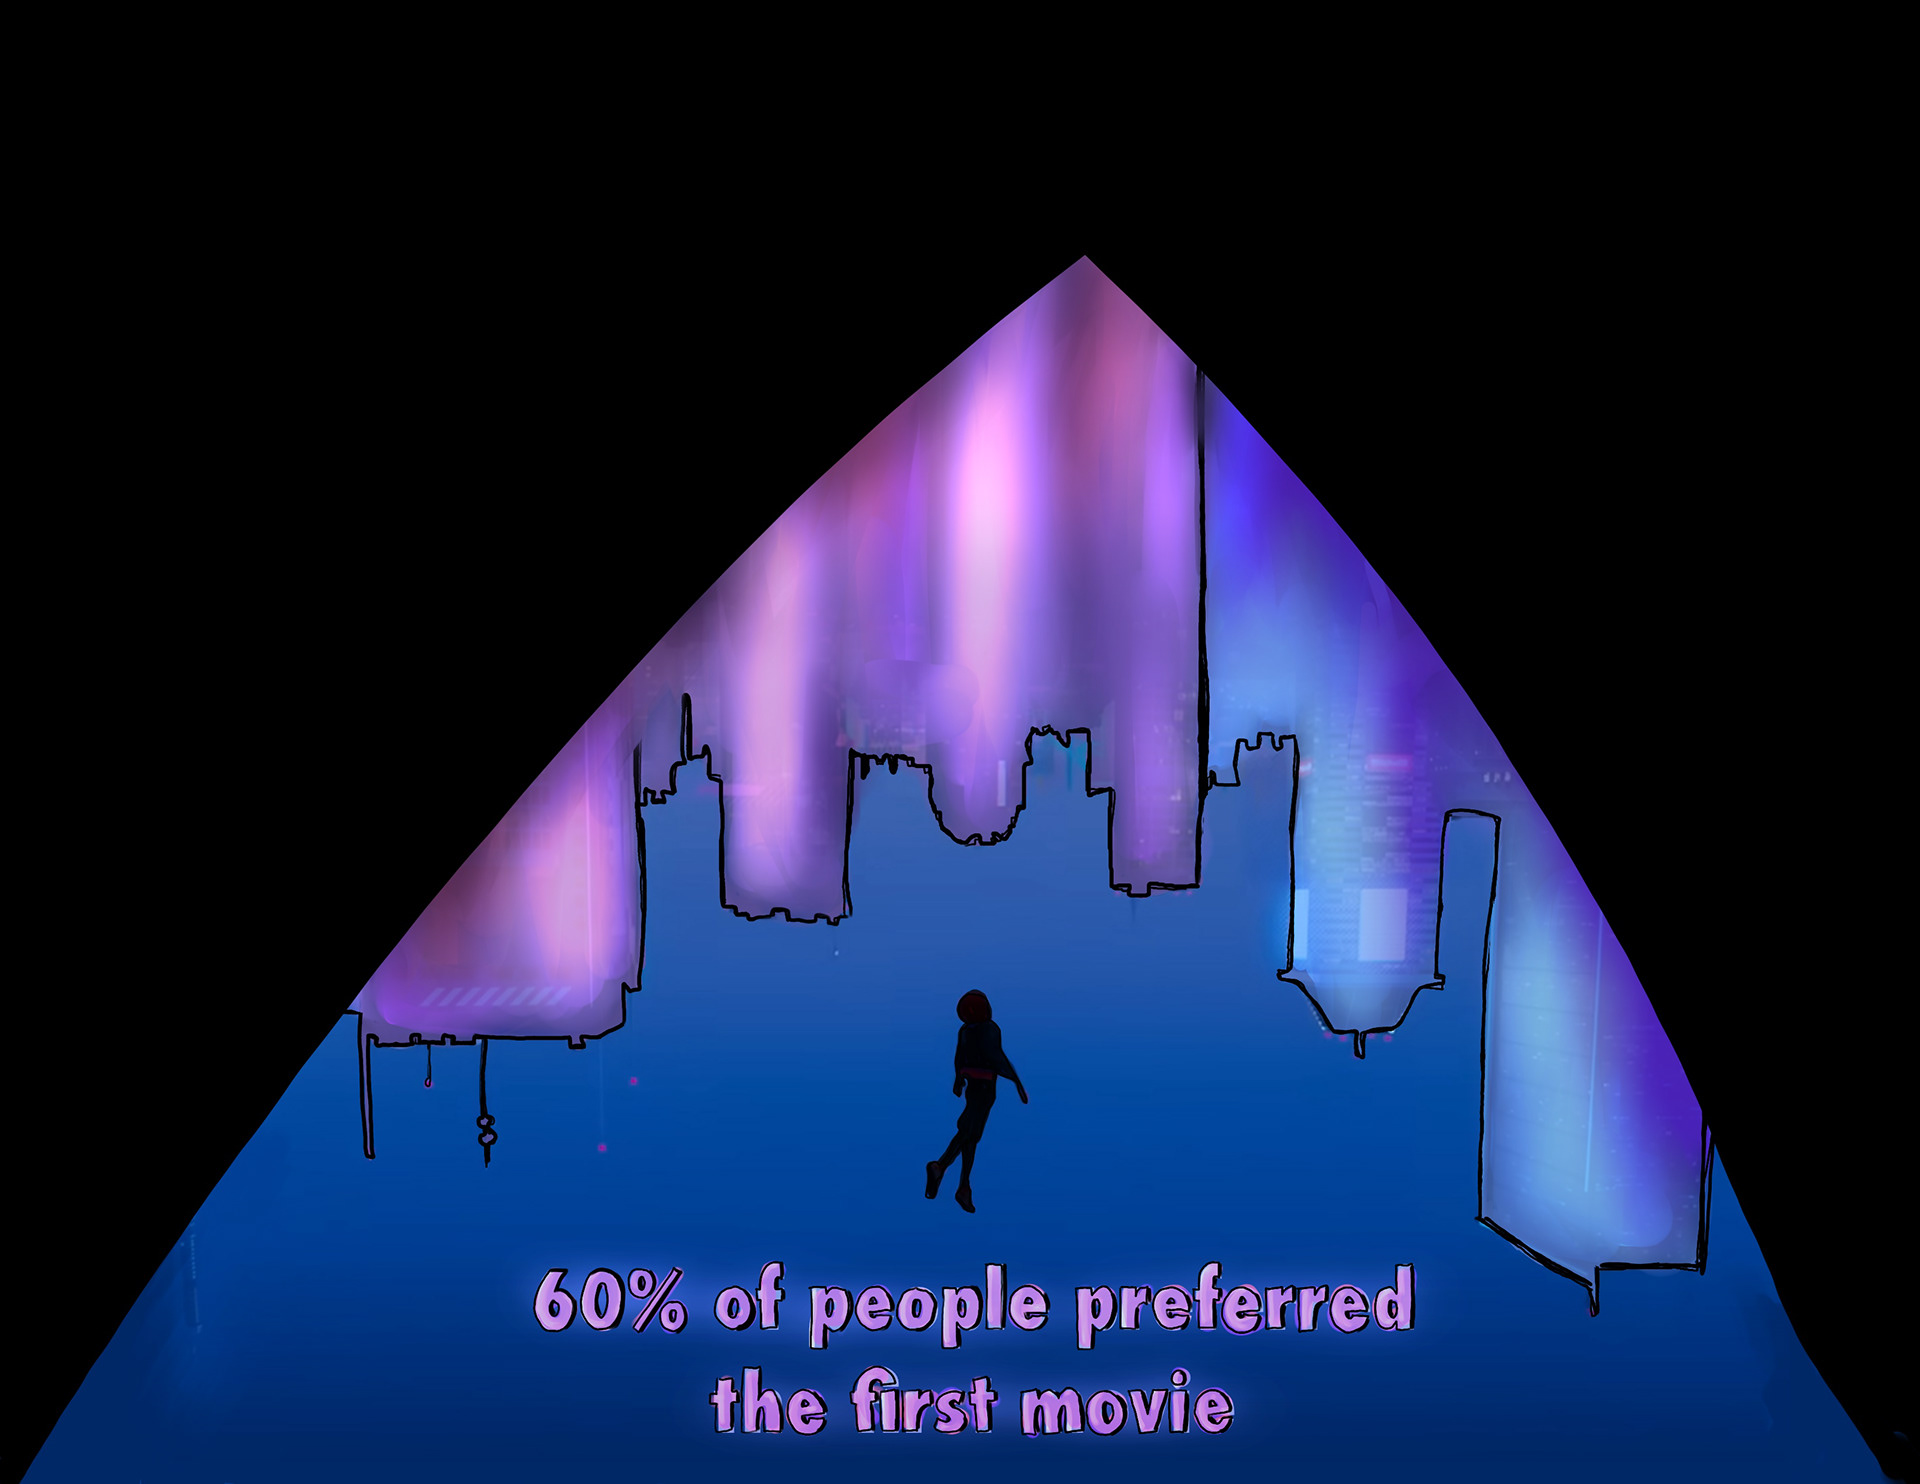
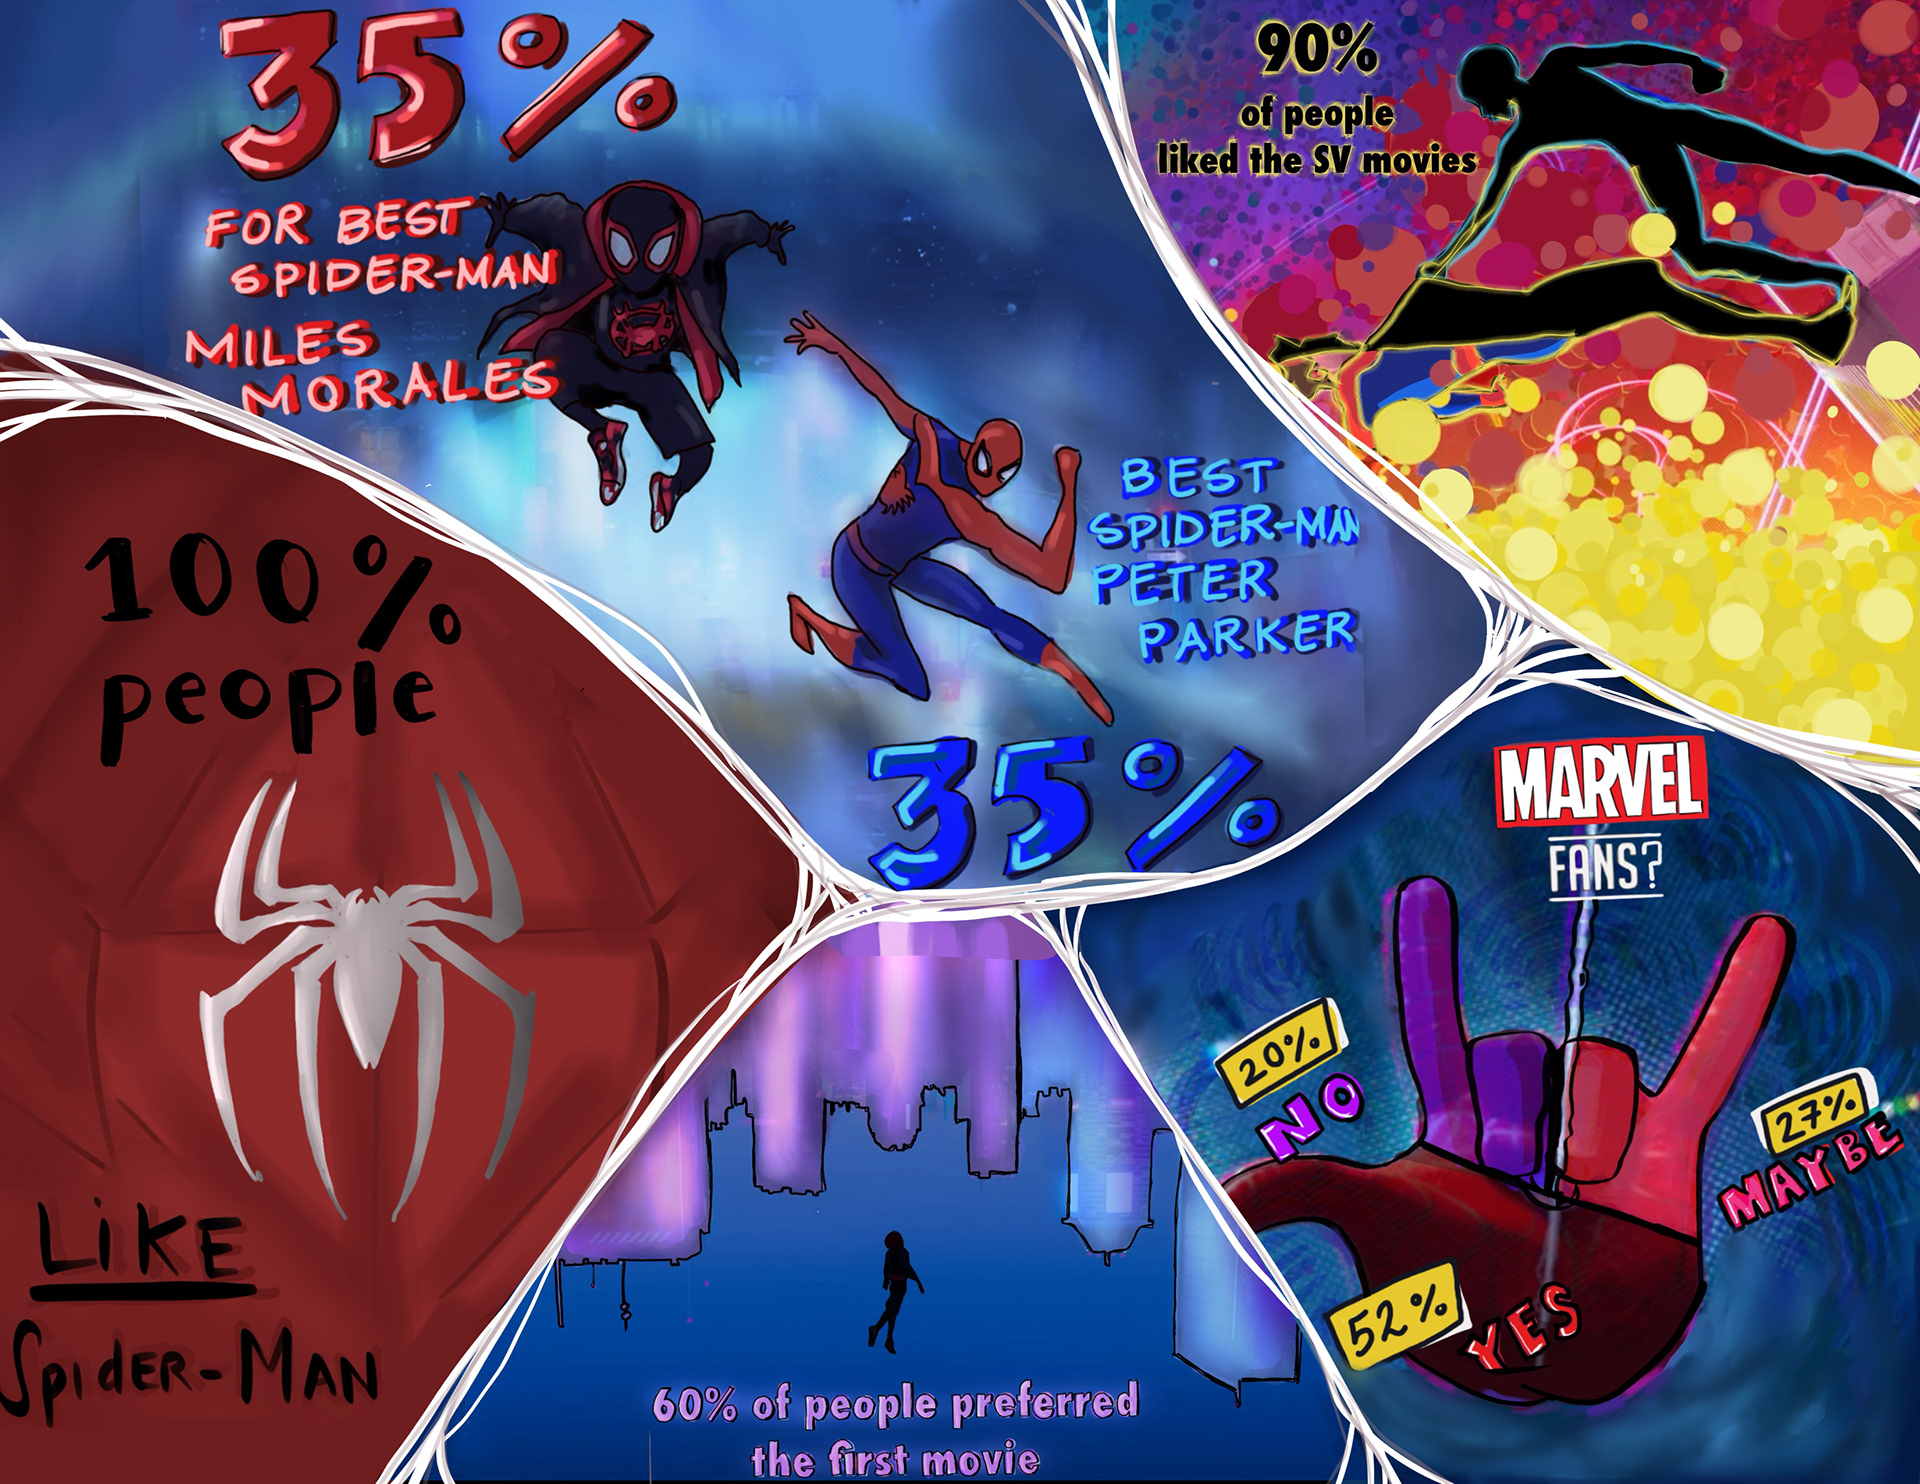
FINAL RESULT INFO GRAPHIC
Testing: Ensured the infographic was interactive and user-friendly by testing it with a small group.
Final Adjustments: Made final tweaks to enhance clarity and visual appeal.
Presentation: Prepared the final version for presentation, meeting the project deadline.
This structured approach allowed me to create a compelling and interactive infographic that effectively communicated the survey results and engaged the audience.